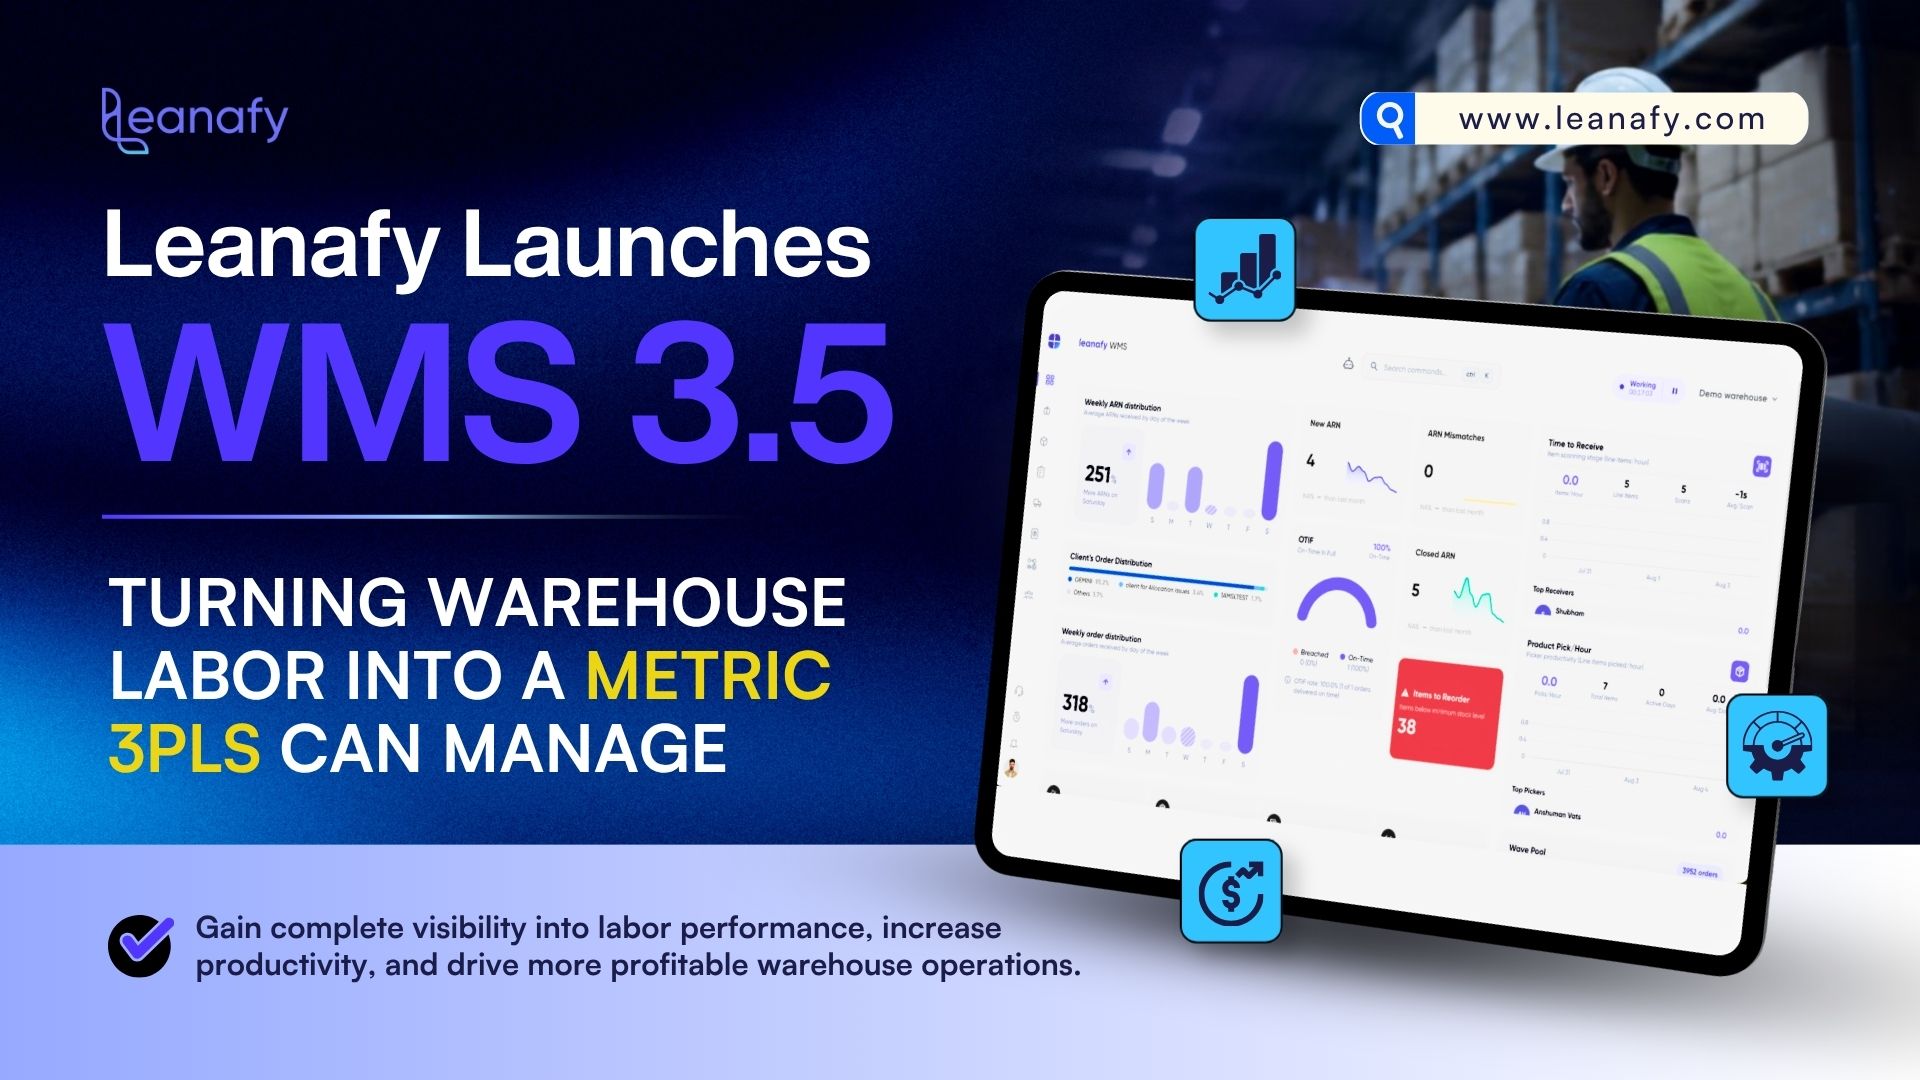
A new Workforce module for labor productivity, with a visual warehouse map, a keyboard-first command layer & speed & precision upgrades to fulfilment.
INDIANAPOLIS, IN, UNITED STATES, August 6, 2026 /EINPresswire.com/ — Leanafy today announced the general availability of Leanafy WMS 3.5, a release built around a single idea: a warehouse can only improve the work it can see. Version 3.5 introduces eight upgrades to the platform, led by a new Workforce module, a full labor-productivity layer that, for the first time, brings the human side of warehouse operations into the same system of record as inventory and orders.
Modern warehouse management systems already capture process work automatically. Every receipt, put-away, pick, pack, and shipment is logged the moment it happens, that part is solved. What no WMS has captured is everything else: the cleaning, maintenance, training, replenishment, cycle counts, and downtime that fill an operator’s shift and quietly determine labor cost.
For a 3PL, that gap is not a footnote. Labor is the largest controllable expense in the building, margins are billed by activity, and staffing decisions ride on numbers that have never included the off-process hours. Leanafy WMS 3.5 was built to close that blind spot, and, alongside it, to strip friction out of the software itself, so operators spend their time on the floor rather than hunting through menus.
“Warehouses have spent a decade automating how they capture process work, and it’s made them measurably faster,” said Vikrant Neb, CEO of Leanafy. “But the single biggest lever a 3PL has, its labor, has stayed almost entirely invisible. Version 3.5 is where we start making that work measurable, and where we make the software itself get out of the operator’s way.”
What’s new in 3.5?
Workforce:
Labor productivity you can finally measure. This is where 3.5’s central idea comes to life. The WMS already logs every scan; the new Workforce module captures the rest of the labor story and turns it into numbers a 3PL can manage. Operators punch in and out, and a custom activity tracker records the time spent on the work the system never saw, cleaning, maintenance, training, the gaps between tasks, so every hour is accounted for, scanned or not. On that foundation sits a full labor layer: a live view of the day’s workload set against who is actually on shift, with coverage across morning, afternoon, and night and prompts when demand and staffing drift apart (“1 order past TAT, consider reallocating operators”); built-in shift scheduling on a drag-to-build 24-hour timeline; a team roster carrying each person’s role and cost; and attendance history for the record. Its analytical heart is the Productivity view, which puts real economics on the board, daily labor cost, blended cost per unit, utilization, and total output, each trended week over week, anchored by Cost Efficiency by Function: unit economics for every operation, side by side. Receiving, picking, packing, shipping, and kit assembly each show their true cost against target, their throughput in units per hour, and the week’s direction of travel. For the first time, a 3PL can see precisely which operation is leaking margin, and act on it, whether that means moving people, revisiting a client rate, or fixing a process. Labor stops being the largest cost no one could measure and becomes the one a manager can steer, shift by shift.
Location Map & Area Management:
The whole warehouse, made visible. Locations are no longer a list of codes; the warehouse is now a map you can read at a glance. Each aisle is a row, each level stacked as it is in the building, every position color-coded by status, vacant, occupied, or on hold, so a full aisle’s state reads in a single look. It’s live and wired end to end: click a position to see exactly what’s stored there, down to the license plate, lot, expiry, and quantity; click the item to land in the redesigned item detail panel. Finding stock, spotting a held location, or jumping from a spot to the item that fills it stops being a query and becomes a glance and a click. Alongside it, a new Area Management canvas lets teams draw the high-level shape of their building, racks, bulk, bins, staging, quarantine, dock doors, packing, and save that layout as the map’s foundation. Today the footprint is a visual model of the warehouse; it also lays the groundwork for what’s next, from showing where operators are on the floor in real time to analyzing and optimizing pick-path performance against the actual layout. The immediate payoff for 3PLs: faster slotting decisions, quicker onboarding for staff who can now see the layout instead of memorizing codes, and fewer mis-picks caused by locations that only ever existed as text.
Navigation built around the way a warehouse runs:
The new sidebar surfaces the pages an operator touches most, ordered the way a warehouse day unfolds: Dashboard, then ARNs for inbound receiving, where the day begins, then Inventory for storage, Orders as demand arrives, the new Fulfilment screen, Invoices to bill clients for the work, Work Orders for everything operational, and Workforce, the newest addition. Each carries a shortcut in that same sequence, Ctrl+1 through Ctrl+8, so muscle memory matches the mental model. The shortcuts are consistent for every user by design, a shared spine through the building’s core workflow, while everything used less often stays exactly where it was, in the full menu. In a job measured in seconds per task, cutting the distance to the next screen compounds across every operator, every shift.
A command layer for the whole warehouse:
The release’s most forward-looking change is more than a faster way to navigate. A keystroke jumps you to any screen, order, item, or location, but the palette also executes: generate and print a QR code, generate or reprint License Plate labels, track a shipment by its number, or search across every entity in the system, all without leaving the keyboard. It turns the things operators do dozens of times a day into a few characters and an Enter, and every new command that ships extends it, less a single feature than a growing surface, one place to find anything and do anything. It is also where Leanafy’s AI agent, Luna, will live, bringing conversational, in-context help and action into the same bar, the command layer as the front door to an assistant that understands the warehouse.
A reimagined item detail panel:
The panel has been rebuilt around the question operators actually open it to answer: where is this item, and how much is available? That data now leads, the first thing on screen is a full-width availability-and-locations table that fits without a single horizontal scroll, while the reference details that once held prime real estate move to a compact top bar. The full-width, no-scroll layout carries across every tab, so the panel behaves identically everywhere, and navigation is keyboard-first: 1, 2, 3, 4 jump between tabs with no mouse travel. Inline audit and transfer controls let staff run a cycle count or move stock without leaving the panel, and a new insights view surfaces the item’s order trend alongside AI-powered analysis of its inbound and outbound movement. Individually these adjustments read as minor; in practice, repeated across every item lookup, every shift, every client, they compound into meaningful time handed back to the floor.
Fulfilment built for speed and precision:
The pack-and-ship experience has been rebuilt around the two things that decide an operator’s shift. The shipping address now sits in plain view on the packing screen, so staff can confirm at a glance that it’s complete, carries a phone number, and looks right, and edit it inline the moment it doesn’t. Until now, the address surfaced only after the label was generated, by which point a wrong one already meant a wasted label and a reprint; showing it up front turns that into a two-second correction. A new search bar in the order list frees packers from working the queue in sequence, grab whatever tote is in front of you, scan it, and go straight to its order. The shipment form has been pared to the essentials so a label goes out in as few clicks as possible, and the whole screen is tighter, trading excess whitespace for density without sacrificing readability. Every change points the same way: fewer wasted labels, fewer wasted motions, more orders out the door.
A dashboard that fits every role:
Every role in a warehouse watches a different set of numbers, a receiving lead, a pack-station supervisor, and an operations manager each carry different responsibilities and need a view built around them. Until now they all got the same static dashboard of basic inbound and outbound metrics, and the gap filled with workarounds: leaning on whichever report happened to match, or downloading data and rebuilding it into a personal Excel dashboard just to see the picture that mattered. Version 3.5 ends that. Every metric is now a widget, and the board is yours to compose, pull from a growing library of pre-built widgets spanning warehouse operations, arrange them the way you think, resize each to the weight it deserves, and filter to your use case. When a team needs a metric that doesn’t exist yet, they can request a custom widget built specifically for their warehouse, a paid option that makes even highly specific, operation-unique numbers first-class on the board. Paired with the Workforce module, the numbers a team cares about sit right beside the ones Leanafy ships. The dashboard finally fits the person, instead of the person working around the dashboard.
Faster filters, a header that stays put, and columns you control:
The filtering experience has been rebuilt app-wide, starting with a fix that was overdue: table headers are now static, staying in place as you scroll long lists instead of sliding off the top. It’s a capability customers had asked for over a long stretch; in the rush of shipping high-impact features, this smaller enhancement slipped for too long, and this release makes it right. The old filter sidebar, slow to open and heavy to load, gives way to a fast filter bar above the table, backed by optimized APIs that return results noticeably quicker. On the Orders page, a new column-customization control lets each user toggle which columns appear and drag to reorder them, so the table shows exactly what that person needs, saved per user, ready the next time they open it. The faster filtering carries across every list in the app; the column control is tailored to the Orders table, where the variety of what teams track is widest.
A deliberate bridge to what’s next
Version 3.5 is a bridge release, a production-ready step between the current generation of Leanafy WMS and version 4, now in active development. Rather than hold these capabilities for a larger launch, Leanafy is shipping them today, so customers can start building the labor-visibility foundation now, ahead of the deeper platform work to come.
Leanafy WMS 3.5 is generally available today to all Leanafy customers across the United States, Canada, and India, at no additional cost. The complete list of changes is published at leanafywms.com/changelog.
Vikrant Neb
Leanafy
email us here
Visit us on social media:
LinkedIn
Instagram
Facebook
Legal Disclaimer:
EIN Presswire provides this news content “as is” without warranty of any kind. We do not accept any responsibility or liability
for the accuracy, content, images, videos, licenses, completeness, legality, or reliability of the information contained in this
article. If you have any complaints or copyright issues related to this article, kindly contact the author above.

Media gallery